The Inside Scoop on Deck.gl vs Mapbox
If data visualization at large-scale is your focus, opt for deck.gl. It outstrips Mapbox with high-performance WebGL2 power and extensive layer types. However, for robust location services and map rendering in diverse applications, Mapbox stands supreme.

Key Differences Between deck.gl and Mapbox
- Coding: deck.gl focuses on large-scale visualization of data using data-driven layers. Mapbox delivers location services through APIs and dynamic map rendering.
- Integration: deck.gl integrates with major basemap providers, while Mapbox uses vector tiles and style instructions for map rendering.
- Applications: deck.gl is widely used for data visualization while Mapbox thrives in diverse applications including web, mobile, automotive, and gaming.
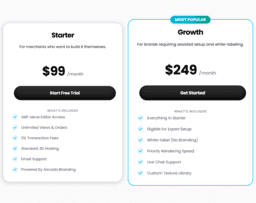
- Pricing: While deck.gl is open to contributions under OpenJS Foundation, Mapbox offers a free tier for developers during development and metered services for production applications.
| Comparison | Deck.gl | Mapbox |
|---|---|---|
| Purpose | Data visualization tool | Location data platform for maps and services |
| Technology | WebGL2-powered | Uses vector tiles and 3D rendering |
| Usage Modes | Script Tag, NPM Module, Pure JS, React, Python | Web, mobile, automotive, gaming |
| Data Sources / Updating | Handles large-scale data; rendering and updating | Mobile sensors, driver feedback, computer vision, aerial imagery |
| Features | Event handling, customizable layers, major basemap support | API for maps, search, navigation, computer vision and accounts service |
| Learning Resources | API docs, demos, playgrounds, Medium blog, Slack workspace | Documentation, blog, webinars, project templates |
| Support | Open for contributions under OpenJS Foundation | Support plans with guaranteed email response for Pay-as-you-go users |
What Is deck.gl and Who’s It For?
Deck.gl is a high-performance, WebGL2-powered data visualization tool, specifically designed for large-scale data scenarios. It simplifies the process of data visualization through its robust framework that interprets data into interactive visual layers, making it ideal for professionals dealing with massive data sets such as data scientists, engineers, and GIS professionals.
Being a part of vis.gl and falling under the OpenJS Foundation, it is open to contributions. It boasts of a feature set that includes cartographic projections and a catalog of well-tested layers, making it a versatile tool for a broad spectrum of data visualization tasks.
![]()
Pros of deck.gl
- High-performance data visualization
- Integration with major basemap providers
- Highly customizable with flexible APIs and extendable core classes
Cons of deck.gl
- Requires understanding of complex APIs
- May require steep learning curve for non-technical users
What Is Mapbox and Who’s It For?
Mapbox is a dynamic location data platform that powers maps and location services across various applications. Born out of the desire to create interactive and dynamic maps, it uses vector tiles and 3D rendering technology to produce visual geographic data, making it ideal for web and mobile developers, game designers, and GIS professionals.
It offers a free tier for developers and proactive support plans, catering to a varied user base. Mapbox constantly updates its map data, providing users with the most accurate and detailed geographical information.

Pros of Mapbox
- Comprehensive location data offerings
- Dynamically created maps with 3D rendering
- Various support and pricing plans available
Cons of Mapbox
- Specific use of Mapbox APIs could be complex
- Frequent changes in pricing structure may confuse users
Here’s a fun and original code snippet using Mapbox and Deck.gl. The Deck.gl part creates a GeoJSON layer using random coordinates, while the Mapbox part sets up a basic interactive map:
Code Examples for Deck.gl & Mapbox
Deck.gl
The following code generates a Deck.gl GeoJSON layer with mock data. It creates line strings connecting pairs of random geographical coordinates. The necessary dependencies are: ‘@deck.gl/core’, ‘@deck.gl/layers’, and ‘d3-random’.
    import {Deck} from '@deck.gl/core';
    import {GeoJsonLayer} from '@deck.gl/layers';
    import {randomUniform} from 'd3-random';

    const randomLat = randomUniform(-90, 90);
    const randomLon = randomUniform(-180, 180);

    const data = Array.from({length: 10}, () => ({
      type: 'Feature',
      geometry: {
        type: 'LineString',
        coordinates: [, ]
      }
    }));

    const layer = new GeoJsonLayer({
      id: 'geojson',
      data,
      pickable: true,
      stroked: false,
      filled: true,
      lineWidthMinPixels: 2
    });

    new Deck({
      layers:
    });
Mapbox
The Mapbox code below sets up an interactive map centered at specific coordinates with a desired zoom level. Be sure to replace ‘Your_Mapbox_Access_Token_Here’ with your actual Mapbox token. Your project also needs to have ‘mapbox-gl’ installed:
    import mapboxgl from 'mapbox-gl';

    mapboxgl.accessToken = 'Your_Mapbox_Access_Token_Here';

    const map = new mapboxgl.Map({
      container: 'map', // Container ID
      style: 'mapbox://styles/mapbox/streets-v11', // Map style to use
      center: , // Starting position
      zoom: 9 // Starting zoom level
    });
Making the Deck.gl vs Mapbox Choice
Deciding between Deck.gl and Mapbox for your data visualization needs can be quite the conundrum. However, your specific needs and audience can guide you.
Data Scientists
Deck.gl shines brightest for Data Scientists dealing with heavy-duty data visualization. This is because it is specifically designed for effective
- high-performance,
- WebGL2-powered
- large-scale data visualization
. These features make handling colossal data sets seamless and efficient. Furthermore, it offers a spectrum of visualization layers and view options – a boon for this audience. 
Developers
If you’re a Developer looking for a versatile tool with scalability, Mapbox could be your go-to platform. Originating from a team of web developers, it is inherently designed to cater to your needs. It features vector tiles and 3D rendering technology for dynamic map creation, effectively serving geolocation data across web and mobile, making it ideal for app developers. Additionally, its premium APIs and data products render it a powerful toolset.

AR/VR Creators
Augmented and Virtual Reality Creators invariably work with complex geospatial data. Here, a versatile, high-performance platform with flexible APIs is mandatory. Deck.gl, specializing in handling large data sets and offering extendable core classes, emerges as the intuitive choice for this segment. Its customizable, flexible APIs and impressive integration capabilities make it a versatile and powerful candidate.

Ultimately, your affinity towards Deck.gl or Mapbox depends on your specific needs. Deck.gl outshines for top-grade, large-scale data visualization tasks, making it a top choice for data scientists and AR/VR creators. On the other hand, the developer-friendly infrastructure, versatility, and scalability of Mapbox give it an edge for app and web developers.
